Layered

All your project's evidence, in one place.

We build tools that bring a project's own data together with the world's open datasets, into one live picture your team can see, question and use.

Sound familiar?

Your evidence is scattered across files, maps and databases nobody opens twice.

The study can't answer the new question that just came up in the room.

One evidence base has to speak to many audiences, and every version drifts.

Selected work

What we've built

Built by our founding team: one platform, applied on real projects.

Urban Studio screen capture
Screen capture; video coming.

01 · In-house foundation

Urban Studio

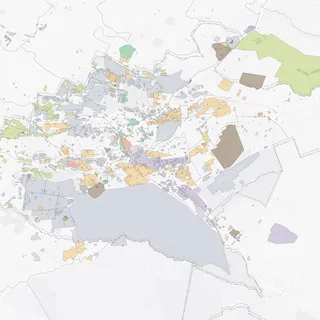
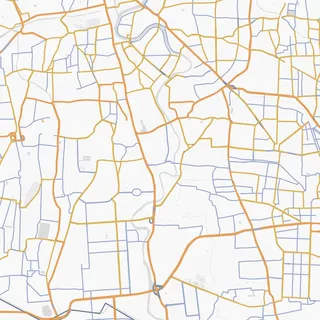
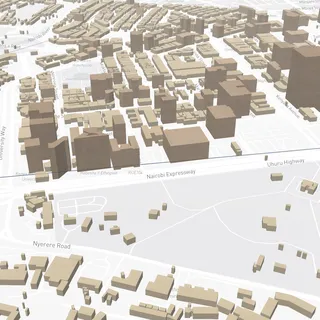
Our in-house foundation, and the base we develop project toolkits from. It pulls global datasets together with your project's own data, with analysis built for each spatial layer, so the studio can read every dataset and synthesise findings against your objectives: rapid spatial analysis for climate, urban and humanitarian projects.

Format
Spatial analysis platform
Status
In-house, self-funded
Year
2024–26
Data
Global open datasets, plus your project's own

The problem

The evidence a project needs usually exists: hazard ratings, terrain, buildings, population, indicators. It just sits in separate portals, formats and papers, and assembling it fresh for every project burns the budget before the analysis starts.

What we built

One place where a project's evidence comes together:

  • Global datasets, ready to go: terrain, buildings, climate hazard, population and development indicators, loaded for anywhere on earth
  • Your data alongside: the project's own files layered into the same live picture
  • Analysis against your objectives: the studio runs what the question calls for and renders it as a view your team can interrogate
  • The base for every toolkit: each project tool we deliver is derived from this foundation, so it arrives already working
Tall-buildings evidence base screen capture
Screen capture; video coming.

02 · For a UK city council

Tall-buildings evidence base

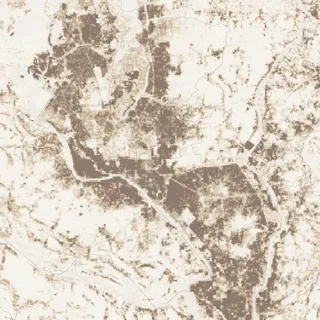
Derived from the Urban Studio foundation and tailor-made for the client: rich 3D data collected at city scale, landmarks included, with quantitative heights and views analysis to derive policy recommendations and model different policy scenarios.

Format
Design-code study
Client
A UK city council
Year
2026
Support
Through the whole project cycle

The problem

The evidence behind "where do tall buildings belong?", terrain, existing heights, sightlines, sun, usually lives in static map plates that can't answer a new question mid-meeting.

What we built

A live 3D view of the whole study area, built on the Urban Studio foundation:

  • LIDAR terrain: heights read against real topography
  • Every building's height across the city centre, landmarks included
  • Sun, shadow and views: analysed quantitatively, by season and hour, per massing option
  • Policy scenarios: hand-traced options modelled and compared, so recommendations trace back to evidence
Our report analysis engine screen capture
Screen capture; video coming.

03 · Self-funded R&D

Our report analysis engine

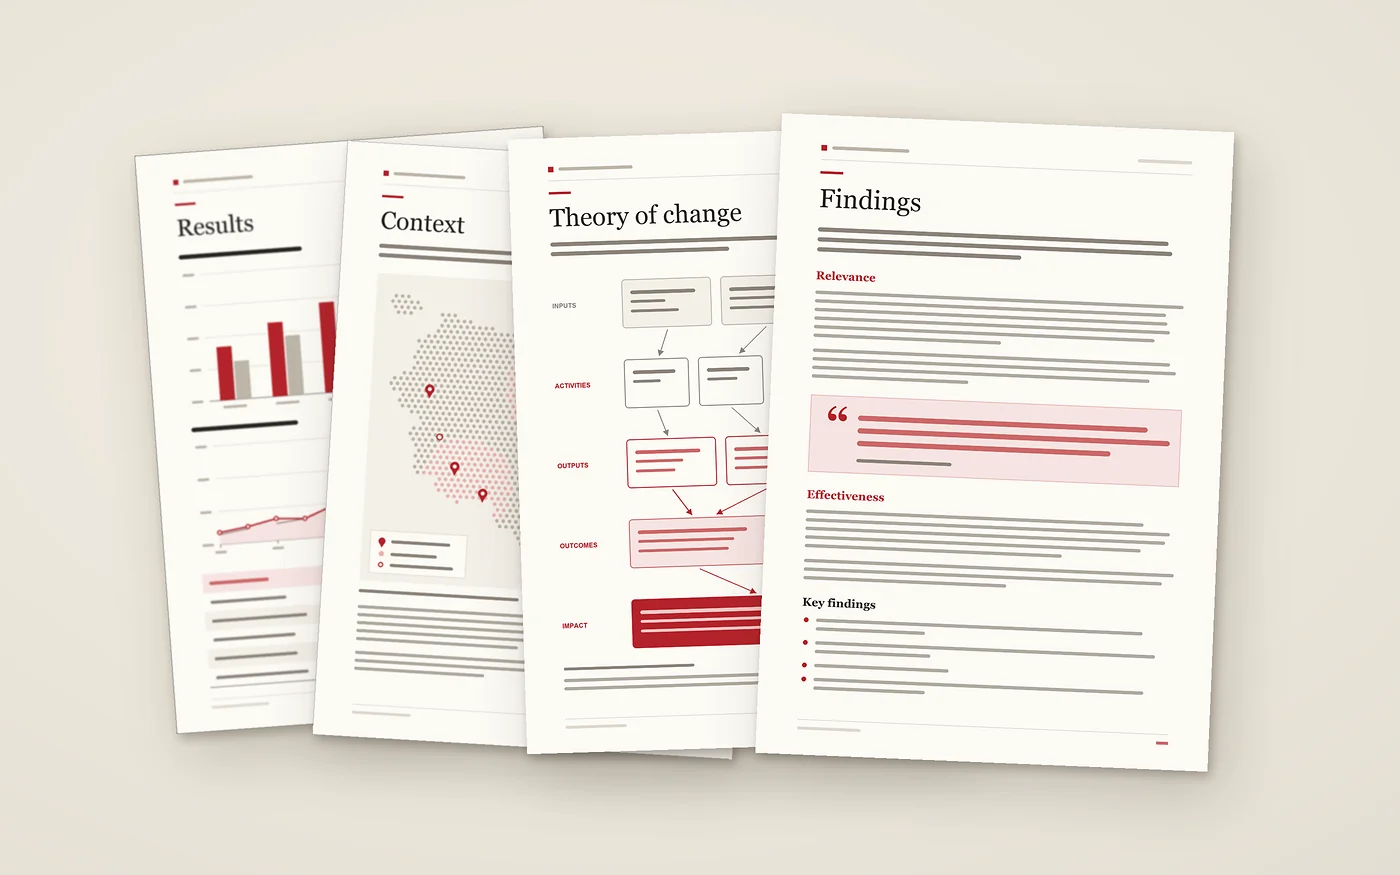
An evaluation we delivered joined a shelf of earlier ones nobody could practically use, so we built an engine that parses large document sets and synthesises findings, tailored to whoever is asking. Its lessons now run inside the Urban Studio, bringing text evidence alongside the map.

Format
Text-analysis platform
Reads
Any document corpus, any size
Year
2025–26
Feeds
The Urban Studio's text pipeline

The problem

Every finished evaluation joins a pile nobody can practically use. The knowledge sits there while the same lessons and challenges get relearned, project after project. And the wider problem is bigger than evaluations: most of what a project needs to know lives in text, in reports, indicators and research, waiting to be read.

What we built

  • Ask the evidence base: answers synthesised across every document, cited back to the source
  • Tailored to the reader: the same corpus answers a programme designer and a field officer differently
  • A reusable foundation: the parsing engine adapts to any text corpus, and now feeds the Urban Studio, where World Bank indicators, ThinkHazard ratings and academic research arrive alongside the spatial data. This is where we work out how text evidence and maps belong together; try it in the studio below.

How it works

From problem to working tool

Ways in

A defined study

A scoped piece of work, delivered through a tool you keep.

A short pilot

A few weeks with your data: a working demo and an honest assessment.

A tool inside your programme

Built with your existing team, structure and budget.

The path

  1. Bring us the problem.

    A study, a review, an evaluation, or something that doesn’t fit a template yet. Two sentences is enough.

  2. We build the working tool.

    A live view of your evidence that your team works with directly, and that produces the deliverable.

  3. The tool works through your project.

    You use it to aggregate your evidence and generate outputs against your objectives, and we stay alongside, iterating it to your needs through the project cycle.

Tell us the problem and we'll shape it together

When to bring us in

Any point in the project cycle

Projects rarely arrive with a clean brief. Wherever yours stands, there is a useful way in.

  1. Before inception

    Shape the idea

    Build the theory of change together and map what is already known, and where the gaps are.

  2. Design

    Plan the evidence

    Methodology for primary data collection: interviews, surveys, web research, open data.

  3. Delivery

    Keep it live

    Project files organised and searchable, milestones and indicators tracked, dashboards updating as evidence arrives.

  4. Reporting

    Reach every audience

    Outputs generated for each reader: funder report, community summary, technical annex.

  5. After close

    Look back with rigour

    A backwards evaluation: reconstruct the evidence and assess it against the original objectives.

The tool and the support fit the stage you're at. Tell us where your project is

Try the studio

See it assemble

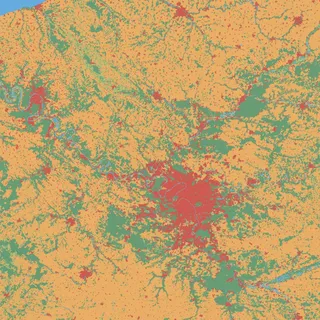
This is a limited demo of Urban Studio, our in-house tool, and a taster of the kind of tools we build. Describe a project and see how the evidence would come together.

The studio is a working prototype. The suggestions above are briefs it handles end-to-end today; for anything else, get in touch and we'll show you directly.

The data

Your data, plus the world's

We bring a project's own data, documents, surveys, spatial files, together with open sources. Every dataset below is global scale: a sample of what we pull from.

Search these datasets in the app
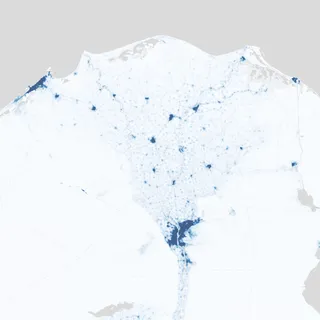
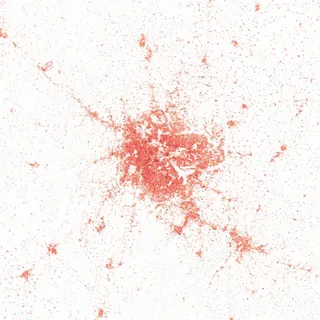
Population Density High-resolution population distribution estimates 100m
Population Density WorldPop
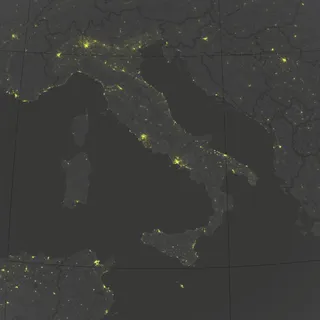
Nighttime Lights Satellite-observed nighttime luminosity 500m
Nighttime Lights NOAA VIIRS
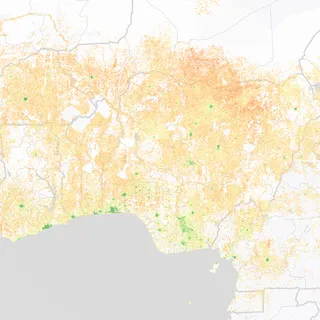
Relative Wealth Index Micro-estimates of relative wealth and poverty 2.4km
Relative Wealth Index Meta Data for Good
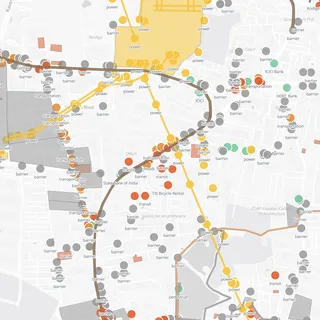
OSM Asset Search Community-mapped infrastructure and amenities Global
OSM Asset Search OpenStreetMap
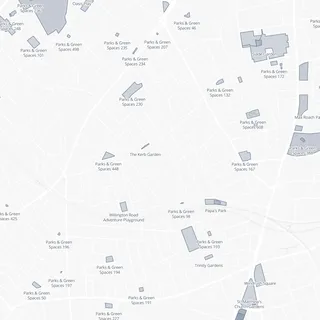
Points of Interest Places, businesses, and public amenities Global
Points of Interest Overture Maps
Building Footprints Individual building outlines and attributes Global
Building Footprints Overture Maps
Infrastructure Bridges, towers, and utility infrastructure Global
Infrastructure Overture Maps
Building Density ML-derived building counts and density V3
Building Density Google Open Buildings
Built Surface Area Global human settlement built-up surface 100m
Built Surface Area JRC GHSL
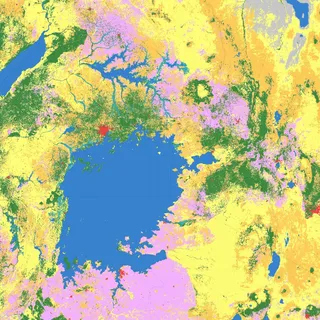
Global Land Cover Land use and land cover classification 10m
Global Land Cover ESA WorldCover
Land Cover Classification Near-realtime land use classification 10m
Land Cover Classification Google Dynamic World
Land Use Zoning and land use designations Global
Land Use Overture Maps
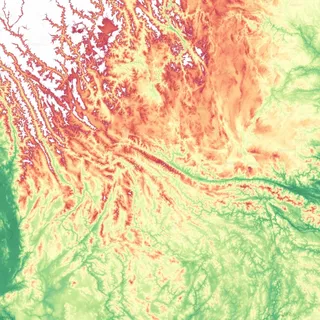
Elevation Digital elevation model from shuttle radar 30m
Elevation USGS SRTM
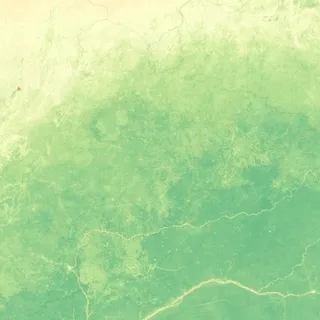
Vegetation (NDVI) Normalized vegetation greenness index 500m
Vegetation (NDVI) MODIS Terra
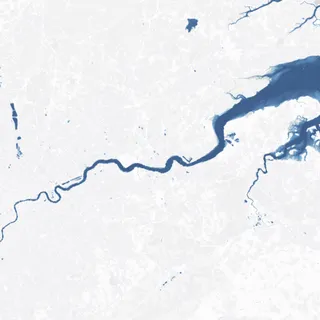
Surface Water Surface water occurrence and seasonality 30m
Surface Water JRC
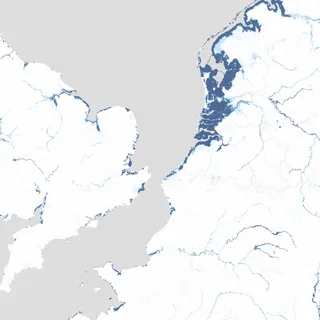
Flood Hazard Flood risk and inundation depth estimates 1km
Flood Hazard WRI Aqueduct
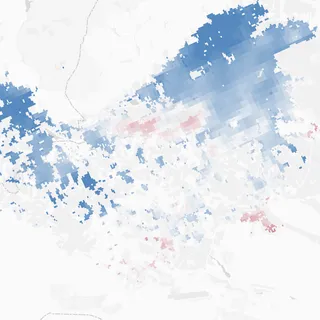
Urban Heat Island Urban-rural surface temperature differential 300m
Urban Heat Island Yale YCEO
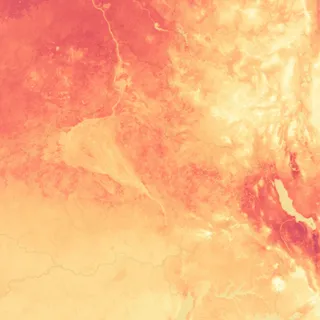
Land Surface Temp Daytime land surface temperature 1km
Land Surface Temp MODIS Terra
Rainfall Climate hazards rainfall estimates 5km
Rainfall CHIRPS
Road Network Community-mapped road network and classification Global
Road Network OSM Overpass
Transport Network Unified transport network segments Global
Transport Network Overture Maps
Armed Conflict Georeferenced armed conflict events Global
Armed Conflict UCDP GED
Recent Conflict Near-realtime conflict event reports Global
Recent Conflict UCDP Candidate
Documents, surveys, GIS layers, spreadsheets: synthesised alongside everything here
Your project data Whatever your project holds

We build tools for people making decisions about places and programmes: councils, humanitarian organisations, evaluators, development teams.

Each tool brings a project's evidence into one place a team can sit in front of and question: documents, spatial data, evaluation evidence, stakeholder input, unified and readable.

Built by practitioners who've worked inside the systems we're improving. Our team brings expertise from multilateral urban development, humanitarian field research and evaluation, and software engineering for secure, high-performance systems. We understand real-world workflows because we've lived them.

Founders

Ayesha Khalil

Co-founder

Multilateral urban development specialist (World Bank, IOM) with experience across international agencies on sustainable infrastructure initiatives. Leads strategy and partnerships.

Jonah Rudlin

Co-founder

Urban and humanitarian development research specialist (IFRC, IFC, UNDP) with field research and multi-national evaluation experience. Leads product and research design.

Kieran Tilley

Co-founder

Software engineer with background in quantitative analysis and health technology (G Research). Leads architecture, engineering, and security.

2019

Origins

Layered began based on a series of ongoing conversations between the co-founders on how new technologies could be made useful within the urban development and humanitarian sectors.

2022

First experiments

Projects generate more information than teams can use. We began testing how software and the first Large Language Models could organise it, piloting a city-scale wellbeing study with the Mayor of London built on public social media data.

2025

Building in earnest

We built working tools for project information: a conversational mapping studio joining open spatial data, and a prototype that makes published evaluation evidence searchable with cited sources.

2026

Client work in earnest

Our first tools built for client projects: a tall-buildings evidence base inside a UK council's design-code review, and the delivery tooling for a multi-country humanitarian evaluation. Each one built on the last.

Contact

Tell us about your project

Two sentences is enough. Whatever shape the problem is, tell us; the unusual ones are often the best fit.

Prefer email? hello@layered.systems